

 +38 067 593 59 77
BASICS OF ACOUSTICS: Acoustic field & Ultrasound control methods
3.5 Acoustic field of the PEP
Emitted PEP waves unevenly distribute in space. To describe the angular distribution of wave energy, the concept of an acoustic field is introduced. The acoustic fields near the PET and at a distance from it are significantly different.
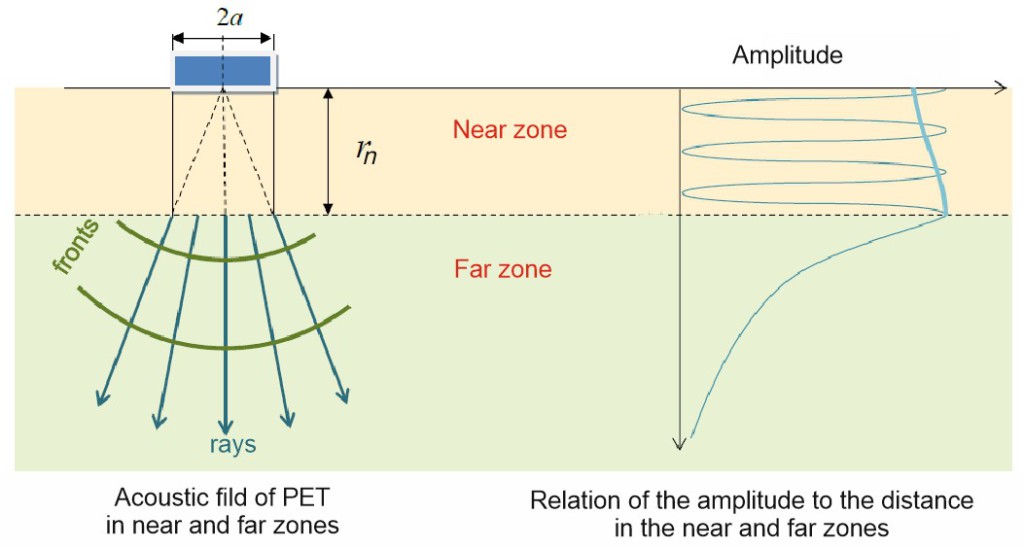
Fig. 3.6 – Near and far PEP zone
The near zone (Figure 3.6) is the region of the tested object located near the source of the waves, in which a non-monotonic change in the amplitude of the oscillations (standing waves) is observed, which is related to the interference of waves from different parts of the PES.
The far zone (Figure 3.6) is the area of the tested object located far from the wave source, and in which the traveling wave with a cylindrical (spherical) front extends. The amplitude of the wave decreases monotonically due to the divergence of the rays from the source.
In the far (wave) zone, the angular distribution of the wave amplitude is described by a directivity diagram (Figure 3.7). In the directivity diagram, the main beam (85% of the total radiation energy) and side lobes (15% of the total radiation energy) are distinguished. The testing technology is developed in such a way that the defects are detected by the main lobe.
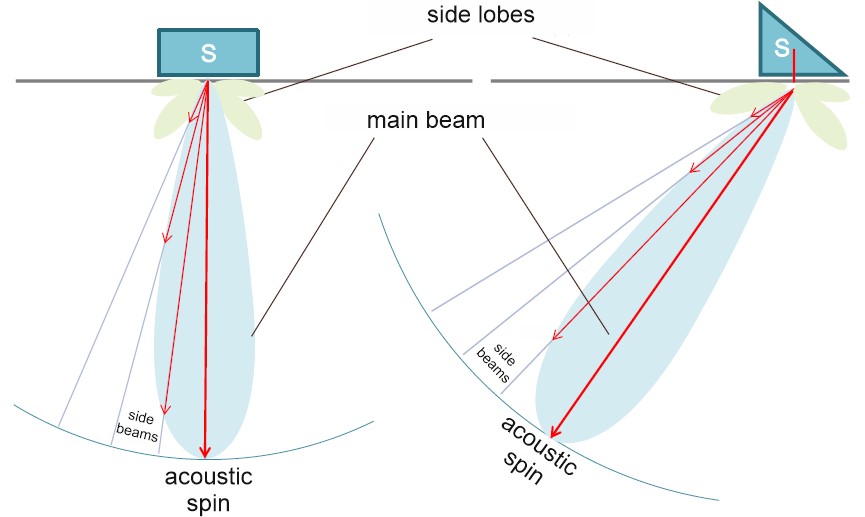
Fig. 3.7 – Directivity diagram of the direct and angular PEP
The angular distribution of the amplitudes (Fig. 3.7) has its maximum in the direction of the acoustic axis, the amplitude of the side lobes decreases with distance from it. The maximum amplitude reflected from the non-directional round reflector will be observed in the position of the reflector at the acoustic axis.
The directivity diagram is characterized by two parameters: 1. the angle of inclination of the acoustic axis. 2. The opening angle of the directivity diagram (see Fig. 3.8).

Fig. 3.8 – directivity pattern parameters
The angle of inclination of the acoustic axis φAA (Figure 3.8) is determined by the prism angle and the ratio of the wave velocities in the prism and in the object of control.
The angle of exposure of the directivity diagram θ (Figure 3.8) depends on the wavelength in the inspection object, the radius of the piezoceramic plate, the angle of the prism, and the velocities of the ultrasonic waves.
A wide beam directivity diagram with a large angle of exposure has advantages in the defect search phase, since it allows sounding of large volumes of material.
A narrow directivity diagram makes it possible to measure the coordinates of defects, to evaluate their shape and dimensions with less error. This is achieved by the ability to set the transducer more accurately to the maximum amplitude position.
In practice, the following parameters of the converter are used to configure the flaw detector: the beam exit point, the time of the PET, input angle, the error of the depth gauge of the flaw detector.

Fig. 3.9 – PEP parameters used to configure the the flaw detector
The time of the PET (Figure 3.9) is the delay time of the wave associated with the propagation of the wave in the prism and the protector of the PET. The time of the PET directly affects the accuracy of determining of the defects coordinates . The time of the PET is to be compensated while tuning on a standard CO-3 or CO-3P sample on the lateral cylindrical surface.
The input angle (Figure 3.9) is the angle between the normal to the surface and the line connecting the center of the non-directional (rounded reflector) to the exit point of the beam in the position of the maximum echo amplitude from the not directed reflector. The angle of input is indicated in the marking of the converter and checked when tuning on a standard cylindrical hole 6 mm in diameter at a depth of 44 mm on a standard CO-2 or CO-3P sample. The angle of the input is approximately equal to the angle of the acoustic axis, but always smaller than it.
- ULTRASOUND CONTROL METHODS
The set of methods for implementing control can be called a method. Methods of ultrasonic testing can be divided into several groups, selected on a single basis. Methods of passage include methods based on recording waves that have passed through the defect in the product. A defect sign in this case is the decrease of amplitude of the transmitted wave at the receiver. As a rule, in the methods of passage, it is not possible to determine the depth of the defect. Reflection methods, on the other hand, are based on the detection of those waves that are reflected from a defect, while the amplitude of the signal perceived by the receiver increases. This principle is the basis of the most popular methods of ultrasonic testing, as it allows to determine the coordinates of the defect, and allows the use of a combined converter.
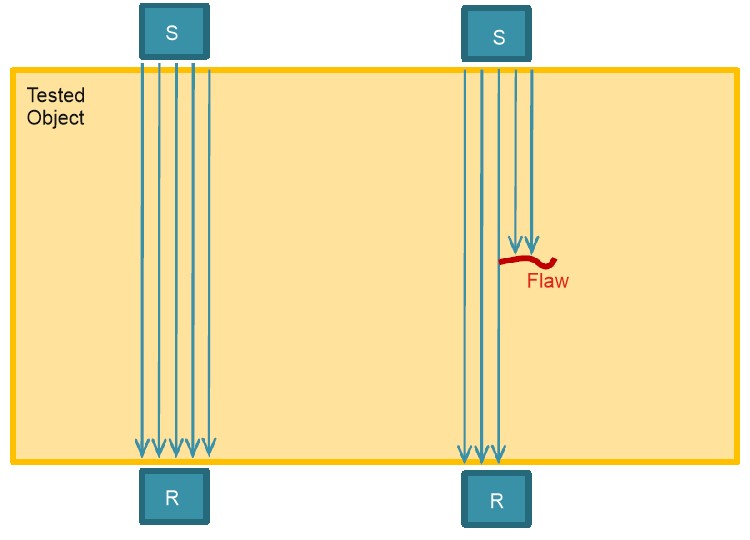
S – source of ultrasonic waves; R – the receiver of ultrasonic waves.
Fig.4.1 – Illustration of the method of passage.
Reflection methods, on the other hand, are based on the detection of waves reflected from a defect, while the amplitude of the signal perceived by the receiver increases. This principle is the basis of the most popular methods of ultrasonic testing, as it allows to determine the coordinates of the defect, and allows the use of a combined converter.
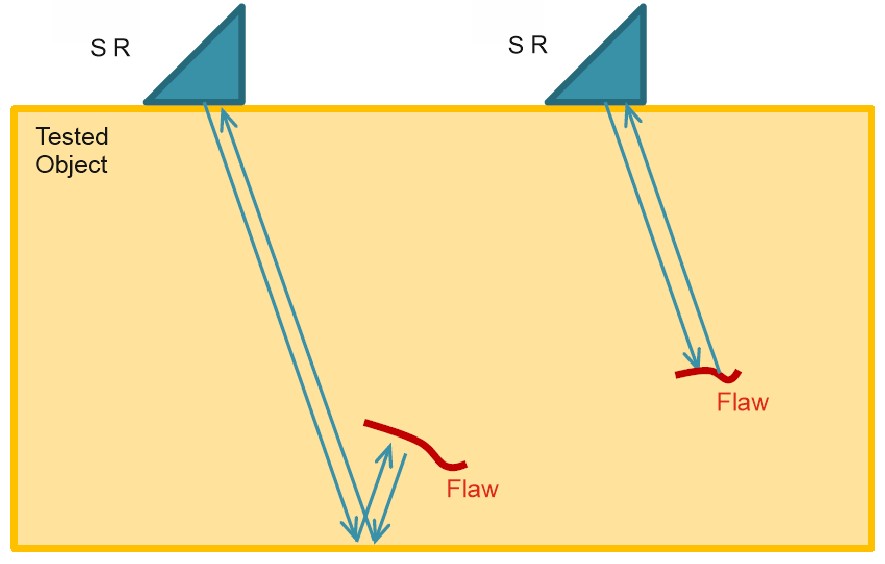
SR – source-receiver of ultrasonic waves (combined converter).
Fig.4.2 – Illustration of the method of passage
Signals generated and received by the flaw detector are displayed on its screen in the form of an A-scan. In this type of sweep, the amplitude of the signal is plotted along the Y axis (in dB), along the X axis, the time of the wave passing to the reflector (in μs). The signals generated by the realization of the reflection and transmission method on the A-scan are shown in Fig.4.3.
The electrical signal generated by the flaw detector for excitation of the ultrasonic wave is called the probe pulse. Its presence at the beginning of the scan explains the appearance of a dead zone – a region near the surface of the input of an ultrasonic wave, defects in which are not detected.

PI- sounding impulse; EI – echo-pulse; SI – strobe-pulse; DI – bottom impulse.
Fig.4.3 – Formation of A-sweep in the general case
The result of the shaping of echo pulses is the waves that came to the receiving PET, reflected from defects, structural reflectors (fillets, holes, etc.). The signal reflected from the bottom of the product is called the bottom impulse. To determine the time interval in which the flaw detector analyzes the amplitude of echo pulses by the criteria of the echo method and the mirror-shadow method (MSM), the strobe pulse serves.
Figure 4.4 shows the implementation schemes of the transmission methods: shadow and mirror-shadow (MSM), in the first the emitter and receiver are on opposite sides, in the second the emitter and the receiver are on the same surface.

Fig.4.4 – Formation of the A-scan for the shadow and mirror-shadow method on the defect-free section
MSM method allows to use direct and inclined PES, the necessary condition is the reflection of the radiated signal from the bottom surface to the receiver. In the absence of defects, the radiated wave arriving at the receiver forms a bottom pulse that exceeds the threshold level.

Figure 4.5 – Formation of A-scan to shadow and mirror-shadow method on the defective area
The appearance of a defect in the path of a radiated wave greatly weakens it, so when the bottom signal is formed, its amplitude decreases. A change in the bottom signal below the threshold indicates a defect.
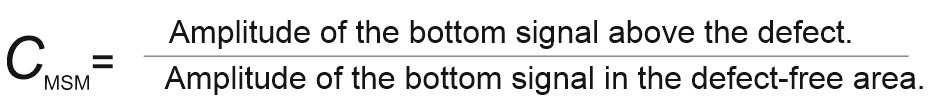
The coefficient of detectability of ZTM – shows how many decibels (how many times) the amplitude of the bottom over the defect decreases relative to the amplitude of the bottom on the defect-free area.
When using the methods of passage, it is necessary to take into account a variety of reasons for the false triggering of defects, the most significant of which are:
– absence of acoustic contact between the PET and the surface;
– non-parallelism of the input surface and the bottom surface;
– changing the thickness of the product;
– condition of the bottom surface;
– attenuation.
Reflection methods are considered to be more advanced and suitable for various diagnostic tasks. Therefore, the echo method is used in almost 90% of ultrasonic control applications

The coefficient of detectability of the echo method shows how many decibels (how many times) the amplitude of the echo pulse from the defect exceeds the amplitude of the echo pulse from the reference reflector.

Attenuation in the material of the test object, the acoustic contact, as well as the size, shape and orientation of the defect affect the amplitude of the echo signal from the defect and, accordingly, the possibility of detecting.
When comparing the mirror-shadow method and the echo method, one can distinguish a number of features of the components, both advantages and limitations of each of them. Therefore, when they are used together, the effectiveness and reliability of the control are significantly increased. Mirror-shadow method allows to detect defects irrespective of their shape and orientation throughout the entire thickness of the product, and if the acoustic contact is lost, this is indicated by the disappearance of the bottom signal. The echo method, in contrast to MSM, makes it possible to determine the depth of the reflector and to assess its shape and orientation. The minimum detectable size of the defect when applying the echo method is limited by the wavelength.